We use Skytap at work to provide us with the variable infrastructure we need in order to support our development and testing cycles. Skytap allows us to dynamically scale the systems we are using for development, testing, product demos, and other proofs of concept. We pay for compute, and storage as we need them, and with a little bit of forethought we can even scale our operations around the globe, and on a monthly basis. I cannot say enough good things about Skytap - they are dynamic and flexible, they listen to us a consumers, and in most cases they provide us with what we need - and if they can’t do it today, they find the resources to do it tomorrow.
Unfortunately, Skytap has done such a fantastic job at letting us dynamically scale our operations that our development and testing teams (along with almost everybody else in the company) has forgotten what it was like when we had five application/database server pairs and ran all of our testing out of there. More importantly, Skytap is so dynamic that our users continue to consume more and more of our Skytap resources, and have surprised us several times when they run into our hard limits. We needed a dashboard that we could easily monitor - without having to log into the Skytap interface. I spend about 25 minutes thinking about the situation, and realized that this was a perfect opportunity to get my feet wet using Dashing.
Dashing, is a neat framework put together by the good folks at Shopify that will provide dashboards for just about anything you can come up with data for. Their tile based layout allows for some nice dynamically sized layouts. Also, Dashing has a nice API endpoint at each of the “widgets” or tiles - making it super simple to update one widget without having to reload the whole page. All the details are at http://dashing.io - check it out.
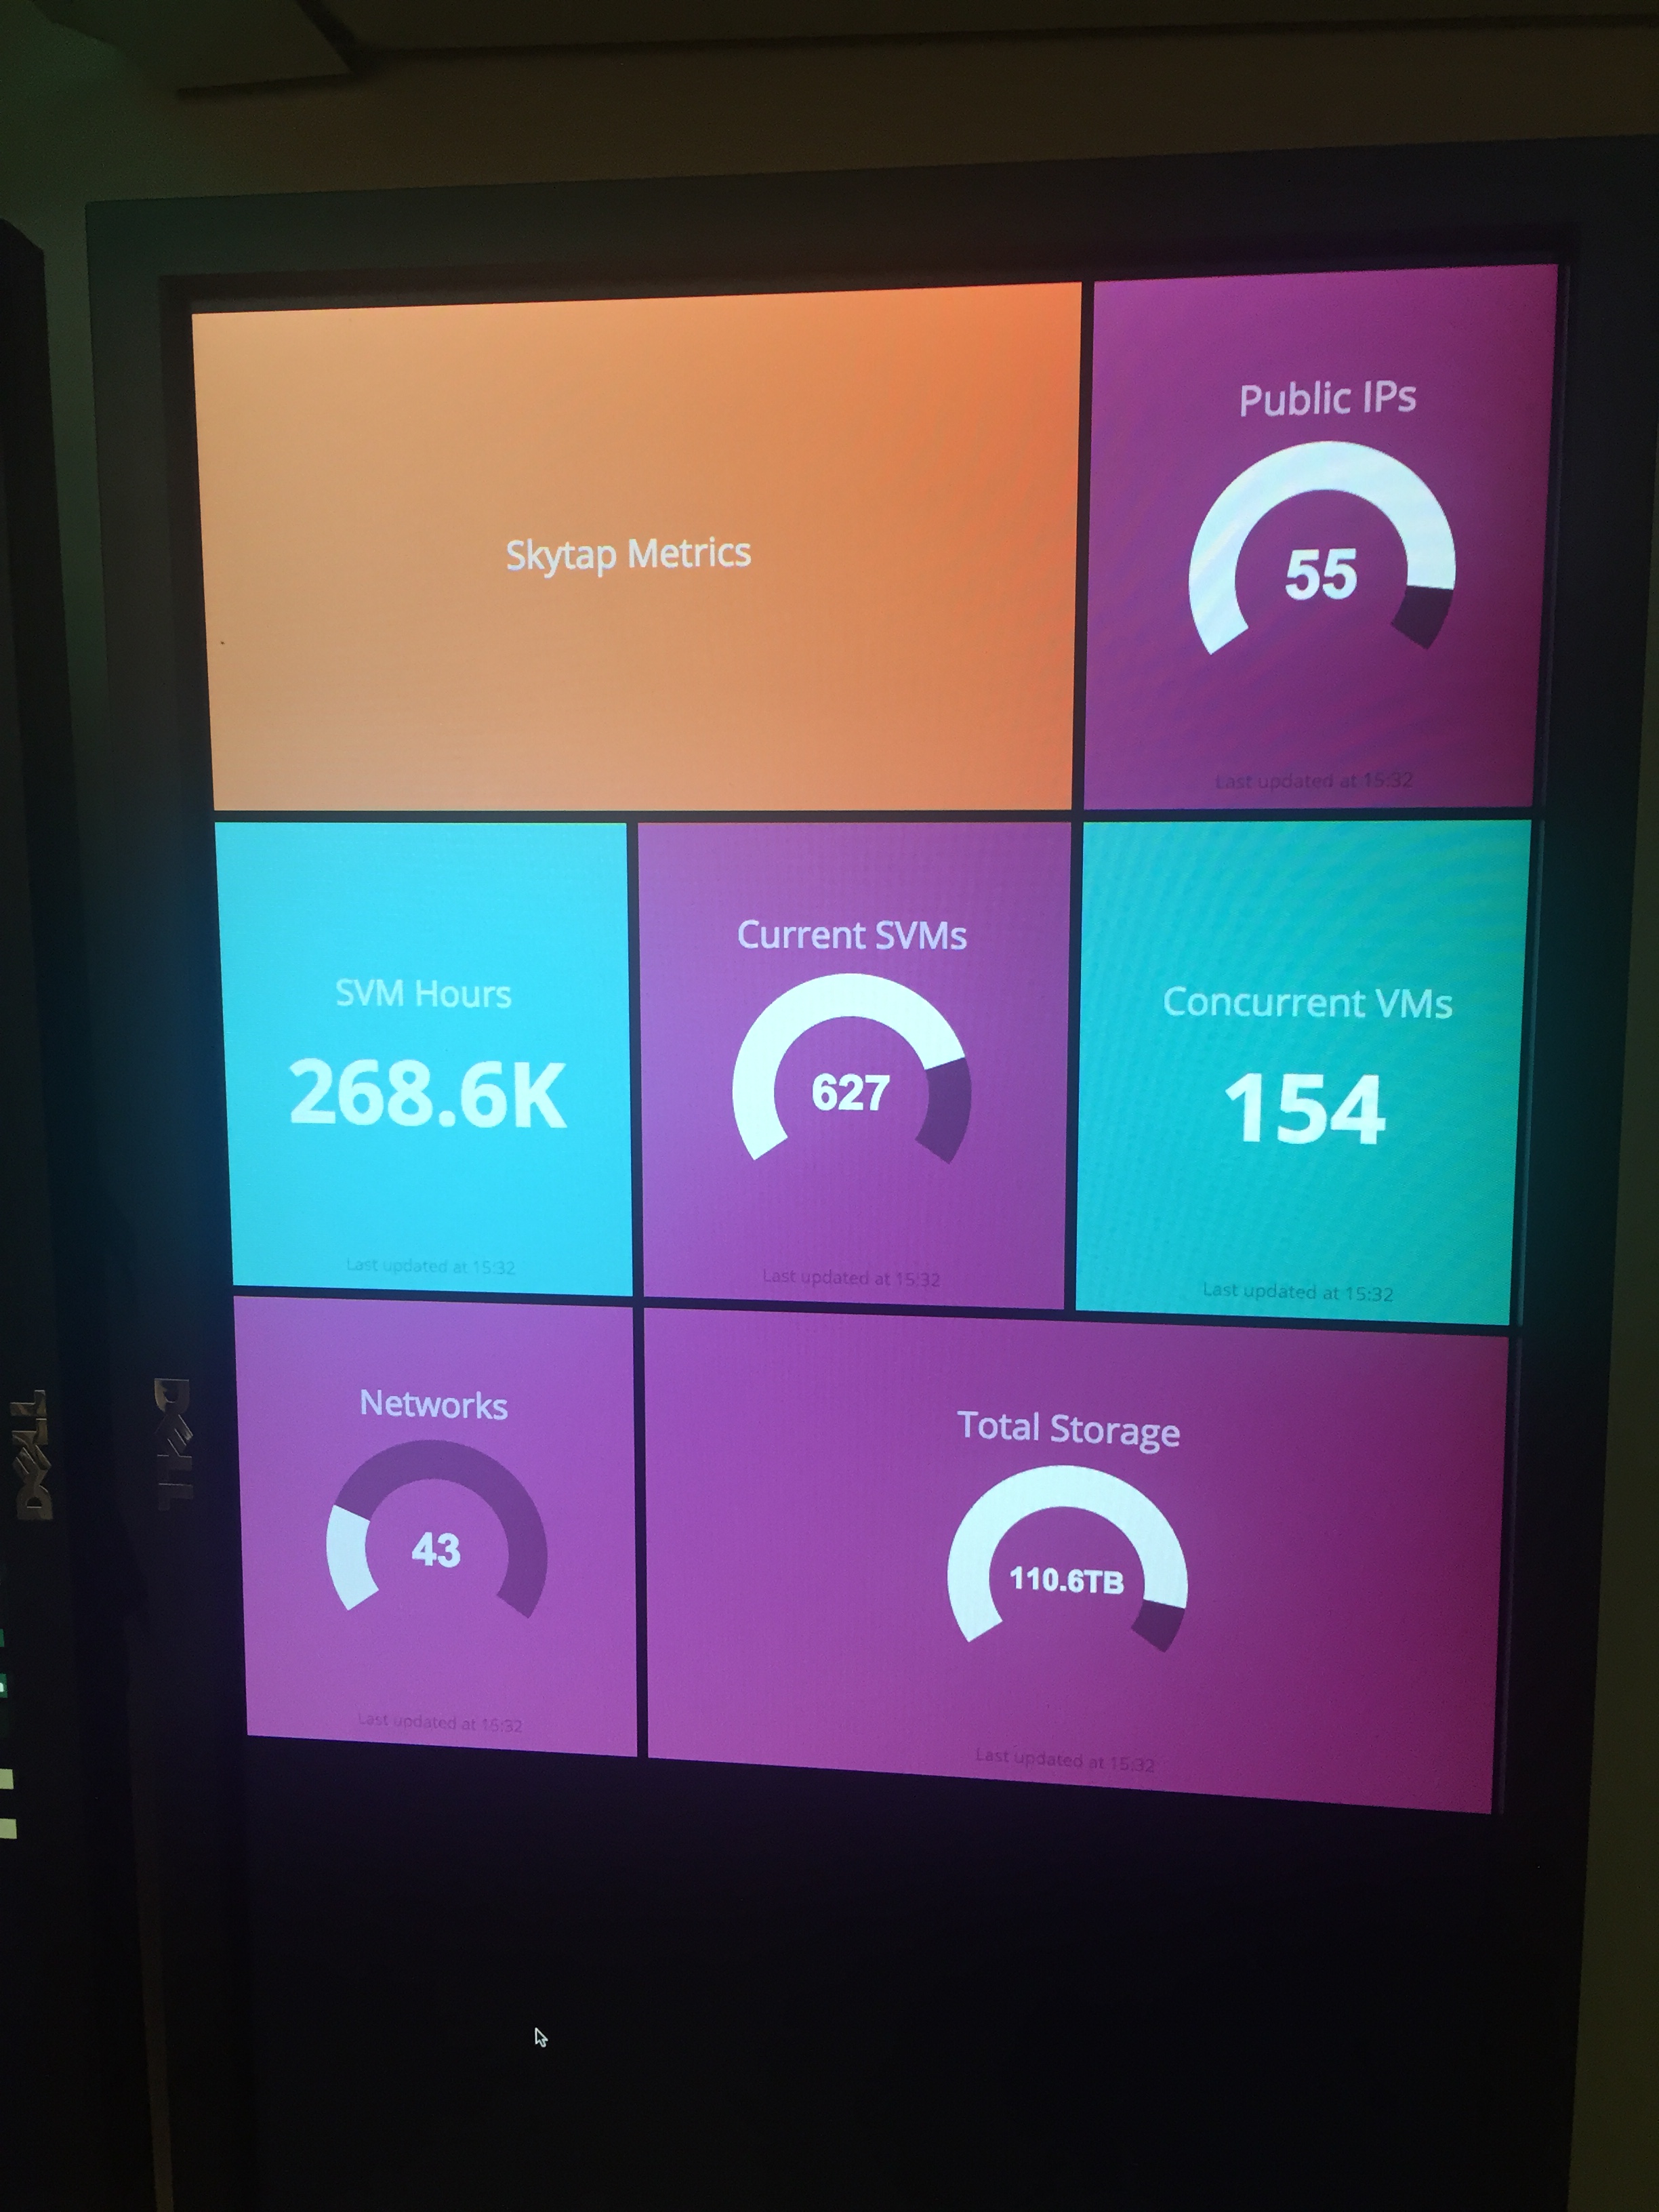
As mentioned above, we had a need to monitor the various metrics that are provisioned for our account in Skytap. Specifically the ones we run up against on a regular basis, Concurrent Running VMs, Concurrent SVMs (an SVM is billing unit based on the amount of RAM and processor cores that a VM is currently using), and Storage. THere are additional metrics, and because it was so easy we put them on our dashboard too - though with the type of account we have, these other metrics do not have hard limits - or the limits are not something we ever run into. They are the Number of Public IP addresses we are using, total SVM Hours for the month, and total number of networks.
Skytap reveals the metrics I was looking for through their Company Quota Resource Each quota object returns a number of fields, including the quota type, usage, limit, subscription, and max_limit.
- Usage: The amount of a given resource that is currently being consumed.
- Subscription - amount of a particular resource you have already paid for as part of your monthly contract.
- Limit - a soft-limit, controlled by account administrators - it is set to a value that is less than the max_limit
- Max_limit - The actual hard limit imposed by Skytap. In our case this is usually 2x the Subscription. If we exceed the subscription, but are below the max_limit, we are in “overage” and just like the cell phone companies, we pay more for resources consumed in this zone.
Dashing made this task terribly easy. I installed Dashing and had metrics inside an hour. Here is what I did:
gem install dashingbundledashing start- point browser to http://localhost:3030
- start curling data at the thing.